
Data Quality (DQ) Metrics: Strategies for Measuring Data Quality
High-quality data meets or exceeds the quality criteria of its consumers. But how do you know whether you have such data? You don’t really know if you don’t have a data quality metrics strategy in place.
This article addresses the following topics pertaining to data quality metrics:
- Why measure data quality?
- Potential data quality metrics
- Potential challenges with metrics
- Strategies for effective data quality metrics
- Parting thoughts
Why Measure Data Quality?
There are two fundamental reasons to measure data quality:
- You want to improve data quality. Deciding to measure something focuses attention on it, indicating where your data quality problems lie and hopefully motivating you to address them. The implication is that an essential step in any measurement program is to determine what you want to improve, then identify what you need to measure to achieve it. Many standard metrics strategies – including key performance indicators (KPIs), objectives and key results (OKRs), and balanced scorecards – are based on this premise.
- Metrics enable effective data governance. Providing accurate and timely measures to senior leadership enables them to govern your enterprise data more effectively.
Potential Data Quality Metrics
Table 1 lists data quality factors, the typical targets that are affected by those issues, and potential metrics for each factor. This is not meant to be an exhaustive list; the goal is to show that meaningful metrics can be captured for each data quality factor. Due to differing terminology between data technologies, I use the following terms:
- Attribute. This can refer to a column in a relational table, a key in a JSON structure, or an attribute in an XML structure.
- Instance. This can refer to a row in a table, a JSON object, or an XML object.
- Source. This can refer to a database, a data file, a service, or a data stream.
- Structure. This can refer to a table, an XML structure, a JSON structure, …
- Value. This can refer to the value of a specific column in a table row, the value of a key-value pair in a JSON object, or the value of an attribute-value pair in an XML object.
Table 1. Potential metrics for each data quality factor.
| Data Quality Factor | Target | Potential Metric(s) |
| Accessibility/privacy. Do people have access to the data that they should, and no more? | Attribute, Source, Structure |
|
| Accuracy. Can you confirm that the data value represents the concept that it is meant to? | Attribute, Structure |
|
| Completeness. Are all the necessary data attributes present? | Attribute, Structure |
|
| Conformity. Is the format or type of the values of a data attribute consistent? | Attribute, Structure, Value |
|
| Consistency. How well does the data align with other representations of it? | Attribute, Structure |
|
| Integrity. Are the relationships between this data and other data correct? | Attribute, Structure, Source |
|
| Precision. How close is the data value to the real-world value? Has it been rounded, for example? | Value |
|
| Reasonability. Do the data values make sense given the context? | Attribute, Value |
|
| Relevance. Is the data what you need and no more? | Source, Structure |
|
| Reliability. Can you trust the data source? | Source, Structure | The other metrics applicable to data sources and data structures are typically combined to provide insight into reliability.
|
| Timeliness. Is the data sufficiently current? | Instance, Source, Structure |
|
| Understandability. Does the data make sense? Is the format/representation clear? | Source, Structure, Value |
|
| Uniqueness. Is the data recorded once and once only? | Attribute, Source, Structure |
|
| Validity. How close is the data value to what it is expected to be? | Value |
|
Potential Challenges with Data Quality Metrics
There are several issues/challenges to consider regarding metrics, including data quality metrics:
- Every metric is contextual. Any given metric applies to some situations but not others, and it reveals different insights depending on the situation. Context counts.
- You get what you measure. When people know how they are being measured, or at least they believe they know how they are being measured, that will motivate them to do whatever they can to make themselves look good based on that metric. For example, you ask a team to calculate the dark data rate for a table in an info mart. This motivates them to focus on supporting question stories that reflect high-usage requests, thereby increasing the chance that a given data instance is accessed, while deprioritizing stories requiring data only for annual reports.
- Sometimes you get what you don’t want. The law of unintended consequences states that actions, such as measurement, in a complex system will have unforeseen and often unintended consequences. For example, you ask a team to collect data timeliness metrics. This motivates them to accept updates from external sources, for example social media data about brand sentiment, more often than is actually needed. This improves the timeliness of that data, improving their metrics, at the expense of increasing the cost of obtaining that data.
- Don’t manage to the metrics. Metrics should only inform, not determine your decisions.
Strategies for Effective Data Quality Metrics
The general advice for how to succeed with metrics is directly applicable to data quality metrics. In my experience, the following strategies prove effective in practice:
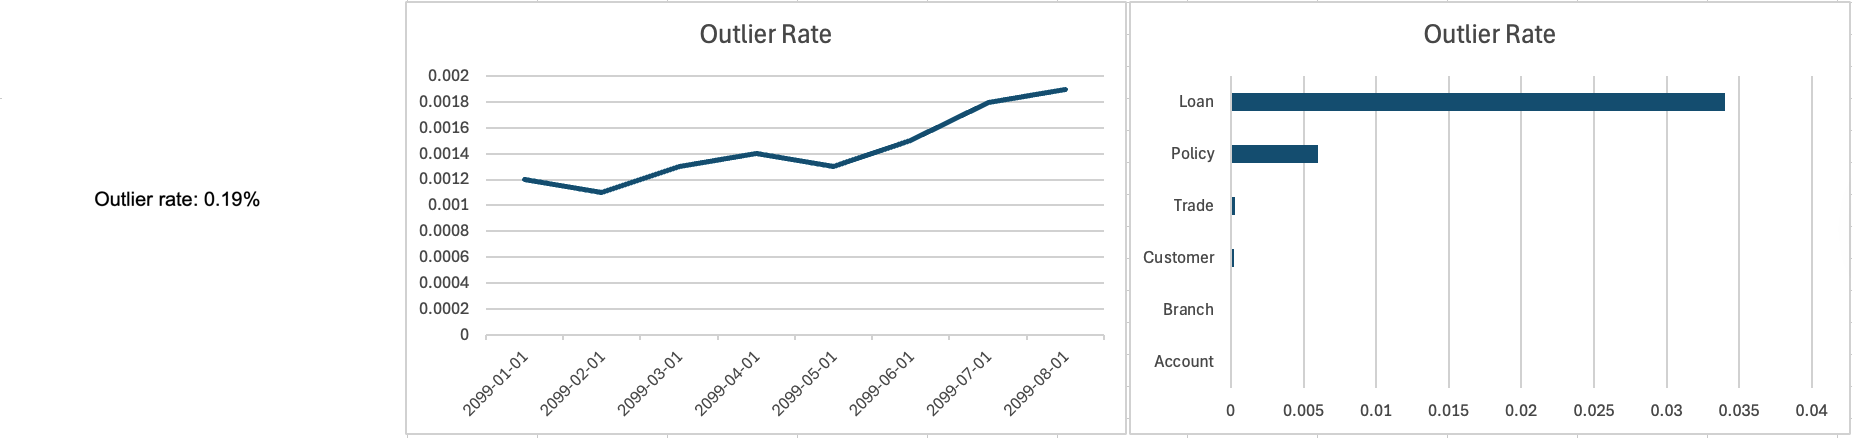
- Trends are better than scalars. Knowing that the current quality level is 87%, which is a scalar value, is interesting but not particularly useful in practice. Knowing that the current level of quality has been rising steadily over the last three months to 87%, has remained flat over the previous three months at 87%, or has been falling for the last three months to 87% is much more valuable. For example, in Figure 1, we see that the current outlier rate for a data source is 0.19%, which for this organization is very low. We’re clearly doing well. But, we also see that the outlier rate has been trending upwards over the last few months, so we’re not doing so well after all.
- Distributions are better than scalars. Knowing how data is distributed, perhaps as a statistical distribution of values or as a distribution by category, can provide valuable insight. For example, in Figure 1 the right-most chart shows us how the outlier rate is distributed across the primary tables in this database. We see that the Loan table, followed by the Policy table, seems to be the most problematic. This is valuable information that would allow us to focus out data repair efforts (if appropriate).
- Never rely on a single metric. It is the combination of metrics, each providing different insights, that enables you to determine how well you are meeting an objective.
- Prefer automated over manual measures. Once the initial investment in tooling has been made, automated measures are less expensive to gather, are less likely to have been gamed, and guaranteed to be tracked.
- Metrics must be timely. Would you be happy to discover that the Outlier rate in Figure 1 was calculated four months ago, before you had a push to clean up your data? Probably not. But what if it was calculated an hour ago?
- Compete against yourself. Comparing people, teams, or even divisions based on metrics is a recipe for dysfunction. In competitive situations, people will do everything they can to game the metrics in their favor, rather than focusing on the behaviors you were hoping to engender via your metrics strategy.
- Metrics must provide positive value. The benefit derived from the metric must exceed the cost of measuring it.
- Prefer leading over trailing metrics. A trailing metric helps you to understand the past, and a leading metric allows you to predict the future.
- Whether a metric is trailing or leading depends on context. For example, defect trend is a trailing metric when used to describe the quality of your work. It is a leading indicator when used to determine the likelihood of releasing on schedule (a long-term trend of a growing backlogof defects indicates you’re likely to run out of time to fix the problems).
Figure 1. Communicating a metric as a scalar, a trend, and as a distribution (click to enlarge).
Parting Thoughts
I believe that data, in particular enterprise data, should be treated as an asset. The implication is that your organization should actively strive to ensure that your data is of high quality. This includes having a pragmatic enterprise metadata program, adopting modern data quality practices, and adopting a pragmatic data quality metrics strategy.
Source
Some material in the article was adapted from my book Not Just Data: How to Deliver Continuous Enterprise Data.