
Agile Analytics: An Overview
- What is agile analytics?
- Why agile analytics?
- Agile analytics practices
- Agile analytics artifacts
- Agile analytics in software development
- Critical success factors for agile analytics
- Related resources
1. What is Agile Analytics?
Let’s start with some important definitions:
- Analytics. Analytics is the exploration of a data source to understand its structure and contents. This is also referred to as data analytics.
- Agile analytics. This is analytics performed in an evolutionary (iterative and incremental) and collaborative manner. Agile analytics is also called agile data analytics.
2. Why Agile Analytics?
Agile analytics addresses the problems associated with traditional strategies to data analytics. These problems are:
- Traditional analytics takes too long. Today’s business needs to make better informed decisions today, not wait for several months while you run an initiative to gather the data they require.
- Traditional analytics is error prone. Although your analysis may be correct at the time, the changing situation that you face may negate some or even all of the work that you did during the time it took you to perform the analytics. In short, you’ve risk having the right answer to the wrong question (your decision needs changed), or the wrong answer to the right question (the underlying data sources shifted), or both.
- Traditional data strategies do not enable change. Traditional data strategies are based on the idea that the data sources remain relatively stable over time, and as a result they are aimed at getting the right answer to start with rather than being easily able to evolve the solution as your needs evolve. This MAY have been true in the 1970s when traditional data ways of working (WoW) were first formulated, it certainly isn’t true today. Modern data professionals need flexible WoW, and that includes data analytics, so as to address the changing needs of their stakeholders.
3. Agile Analytics Strategies
There are several agile strategies that are critical for successful agile analytics:
- Questions drive your requirements. Most agilists will tell you that user stories should drive your requirements efforts, and traditional data professionals will tell that data models should. Although both of those strategies can be made to work, there is a better option: question stories. A question story is a modified version of a user story that is data oriented, in this case it describes a question that someone needs to get answered. Question stories describe thin slices of value for your stakeholders.
- Just barely good enough (JBGE) results. There’s an old saying: Perfection is the enemy of good. A fundamental agile concept is that your work needs to be sufficient, or as agilists like to say, just barely good enough (JBGE). This concept applies to the work artifacts that you create, as well as to the final solution that you produce. Although some people are uncomfortable with the term JBGE at first, the key observation is that once something is good enough, any more investment in it is wasteful. The effort that you waste in making something more than good enough is effort that you could have invested in something else.
- Active stakeholder participation. The people who best know what they need, who are best suited to explore those needs, are the person(s) whom you are doing the analysis for. Yes, they likely don’t have the analytics skills needed to explore the question, which is why they need to work with someone who has those skills. Nor do stakeholders immediately know exactly what they want. They may have an initial idea, and once shown something they may be able to identify what they like and don’t like about it, and they’re likely to rethink things over time. The implication is that if you want to produce something that actually meets their needs then you’re going to need to collaborate closely with them in an evolutionary manner: In other words, an agile manner! The Agile Modeling practice of active stakeholder participation describes how to do exactly this.
- Look-ahead data analysis. When it takes several days, and sometimes weeks, to perform data analytics how do you remain agile? The answer is to perform look-ahead data analysis. The basic idea is that you do just enough analysis work to explore and understand the data source(s) so that a data requirement can be implemented.
- Clean database design. Although database design isn’t a direct analytics strategy it is certainly an enabler of effective analytics. The cleaner the design of your data sources, including the target reporting data source(s), the easier they are to work with by a data analyst. For more information, read clean database design.
4. Agile Analytics Artifacts
There are several key artifacts that are potentially used, and often evolved, by agile data analysts in the course of their work. These potential artifacts are overviewed in the following table. A given artifact should be created if it adds value and should only be developed to the point where it is JBGE.
| Artifact | Use |
| Conceptual model. A conceptual model is a high-level data model, showing the main domain entity types and the relationships between them. | Map the logical landscape of the domain so as to provide an overview of the data that you are working with. |
| Data source architecture diagram. A data source architecture diagram is a form of network diagram that depicts the data sources that you’re working with and optionally how they are accessed. | Map the physical landscape of your technical data infrastructure that you are working with. |
| Data source-to-target map. A data source-to-target map traces source data elements through to where they are used to answer stakeholder questions. | Model how data elements are worked with from beginning (the original data sources) to end points (tables, views, reports, …). Mappings of physical elements to logical data elements captured by your logical data model(s) may also be included if required. |
| Logical data model. A logical data model captures relevant domain entity types, their data elements, and the relationships with other entity types in an implementation-neutral manner. | Capture the logical details of the domain, often to support your source-to-target mapping efforts. |
| Physical data model (PDM). A physical data model (PDM) depicts the physical implementation details of the structure of a data source. | Communicate the physical implementation details of a data source and better yet automatically generate the data source structure. |
| Question story. A question story is an extension to classic user stories in that they summarize a question that a stakeholder wants the answer to. | Capture usage requirements as thin slices of value. |
| Report sketch. A report sketch, sometimes called a report layout, depicts the user interface (UI) design of a report. This could be as simple as a hand-drawn sketch to something (yes!) to something as complex as a software-rendered UI prototype (avoid). | Explore the design of a potential report or dashboard widget/screen. Communicate that design to the implementers. |
| Report specification. A report specification captures the information required to implement a report. This will often include a report sketch, source-to-target data mappings for any data element appearing on the report, and any business logic required for calculated data elements. | Capture the detailed design of a report or dashboard widget/screen so that it may be implemented. |
5. Agile Analytics in Software Development
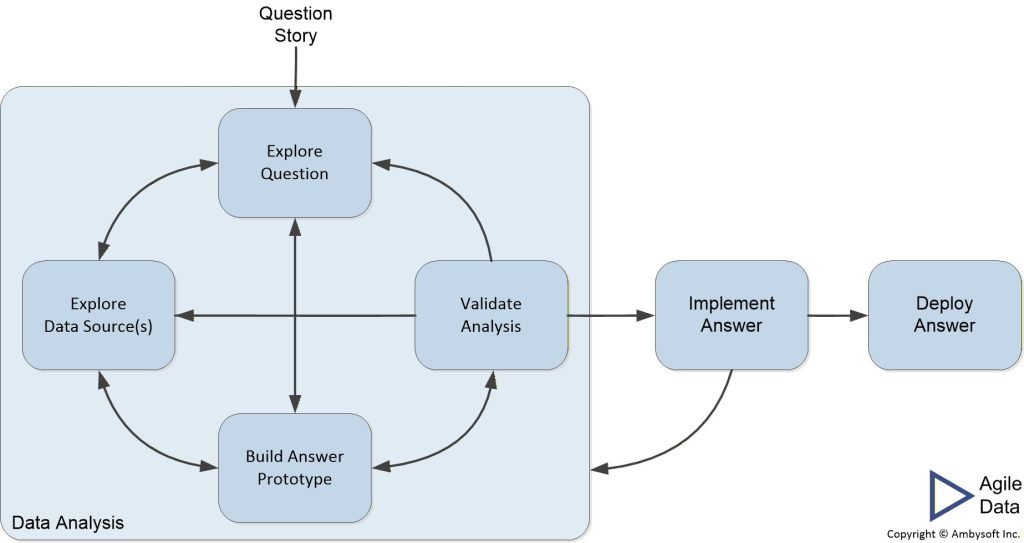
Figure 1 depicts how agile analytics fits into the implementation process for a single question story when the team is following a Scrum lifecycle. Similarly, Figure 2 shows how agile analytics fits in when the team is following a continuous delivery lifecycle. Either way, the agile analytics part of the work is effectively the same. You can read more in Implementing Question Stories.
Figure 1. Implementing a question story on a Scrum team (click to enlarge).
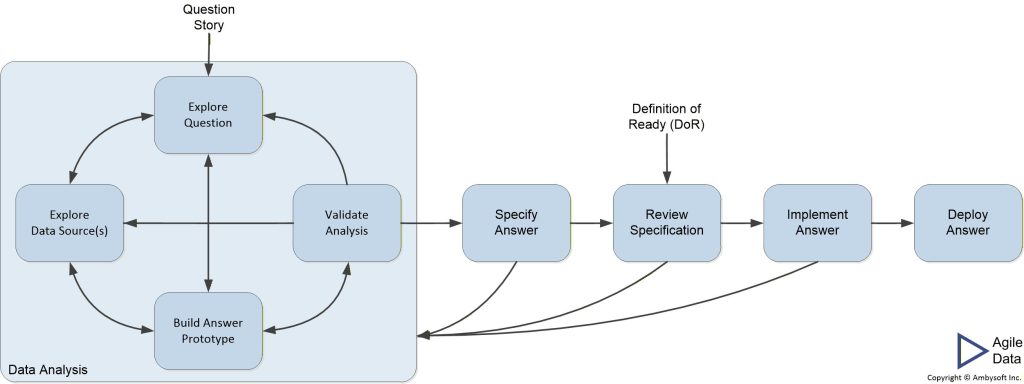
Figure 2. Implementing a question story on a continuous delivery team (click to enlarge).
6. Critical Success Factors for Agile Analytics
The following factors are critical to your success at agile analytics:
- Embrace ambiguity. Your stakeholders will struggle to define what they need (hence work closely with them). They are able to tell you what they like, and what they don’t like, when you do deliver something (hence take an evolutionary approach).
- Embrace change. Your stakeholders will change their minds, your organizational priorities will change, the ecosystem in which you operate changes, and the technologies that you work with change.
- Keep it simple. Your work should be just barely good enough (JBGE), just barely sufficient, for the situation at hand.
- Work on thin slices. A thin slice is a small piece of value that you can deliver to your stakeholders. It is one part of your overall solution, not the entire solution. An effective way to identify valuable vertical slices is to focus on addressing question stories.
- Collaborate closely. Work closely with your stakeholders, ideally every day, so that you understand what they need and what is most important to them (so that you can focus on that first). The practice of active stakeholder participation is key to close stakeholder collaboration. Furthermore, work closely with your colleagues, collaborating with them to deliver value to your stakeholders. Share your skills and knowledge with them, and similarly choose to learn from them.
- Fix data at the source. One of the unfortunate challenges of data analytics is the range of data quality that you’re forced to work with. My advice is to be intolerant of low quality data, also known as data debt. When you run into quality problems with your organization’s data sources, point them out. When the owners of those data sources push back, point out that strategies such as database refactoring can be applied to safely and incrementally address their technical debt. We need to stop looking the other way. This is an aspect of being quality infected.